Speech Processing
Speech processing has been defined as the study of speech signals and the processing methods of these signals, and also as the intersection of digital signal processing and natural language processing.
Speech processing technologies is used for digital speech coding, spoken language dialog systems, text-to-speech synthesis, automatic speech recognition. Information (such as speaker, gender or language identification, or speech recognition) can also be extracted from speech.
Speech may be a more intuitive way of accessing information, controlling things and communicating, but there may be viable alternatives - speech is not necessarily the "natural" way to interact with your computer.
Speech is hands-free, eyes-free, fast and intuitive.
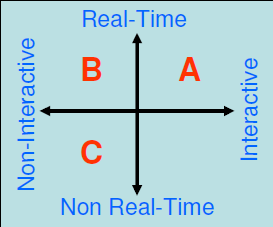
Applications can be interactive or non-interactive. Conversational human-machine interfaces would be considered interactive and fall into quadrant A. Monitoring speech communications less so, and would fall into quadrant B. Additionally, we can consider real-time vs. non real-time. Live speech transcription falls into quadarant B, but speech data mining into quadrant C.
Applications of speech technology can be grouped into Command & Control, Communications, which would fall into quadrant A, Information, which would cross quadrants A, B and C, Intelligence in quadrants B and C and Processing in the remaining quadrant. Tasks get increasingly harder the further away from the centre of the chart it becomes.
Pure Data (Pd)
Pure Data is a visual signal programming language designed to operate on audio signals.
It works by taking a dataflow made up of objects, connections and data. Objects have inlets and outlets, and the connections can either be thin, for message data, or thick, for audio signals.
For a full guide, see
the lecture slides.
When connecting objects together, the left connection is considered "hot" or live, that is, changes in inputs are immediately reflected in the output, whereas right connections are "cold" and need to be banged to update itself).
Audio objects always have a name ending with a tilde (~) and the signal travelling down an audio connection is made up of blocks of samples (single floating point values) - 64 samples are grouped together into a block. Objects that operate on signal blocks behave like ordinary message objects, but process one whole block at a time. Signals are processed synchronously with the soundcard sample rate.
Speaking
Generation
The speech chain consists of various levels, and speech travels up the speakers chain, and then down the listeners chain. The speaker starts at the linguistic level in the brain, which transmits signals to the vocal muscles at the physiological level. This in turn causes sound waves at the acoustic level which goes to both the listeners ear, and the speakers ear to provide feedback. These sound waves are converted by the ear to nerve signals at the physiological level, and then pass via the sensory nerves into the brain for the linguistic level.
Slide 4 contains
a good diagram.
The human vocal apparatus has evolved for a number of uses, including breathing, eating, vocalising and speaking. The human vocal organs consist of a path starting at the lungs, which lead to the vocal folds and the pharynx. From the pharynx, this feeds the velum and the nasal cavity for nasal speech, and the oral cavity, with the tongue, lips and passive articulators for oral speech. These combined form what we call speech.
The passive articulators are when the active articulators (the tongue, etc) hit parts of the mouth (such as the pallete).
The vocal cords and epiglottis form what is known as the voice source. Air pressure from the lungs build up behind closed vocal cords and the vocal cords are repeatedly forced apart and pulled together again, producing a series of small pulses of air. This causes the air in the vocal tract to vibrate quasi-periodically, and the frequency of this vibration determines the fundamental frequency (Fx or F0) of the speech waveform. This fundamental frequency contributes to the perceived pitch of the voice.
The acoustic output from the vocal tract is initiated by the closure of the vocal folds. A chart of the waveform produced (example on slide 9 of lecture 3) consists of a closed phase and an open phase. As the glottis opens, there is a more rounded corner in the waveform, but a sharp corner at the glottal closure as the glottis "slaps" back together.
Characteristics
The voice filter consists of the upper part of the vocal apparatus that forms a resonator with a complex shape. These resonances are known as formants.
Speech is produced by using the articulators to change the shape of the vocal tract, hence modifying its resonant characteristics. Different configurations of the vocal tract enhance some of the harmonics of the fundamental, but suppress (dampen) others. The principle articulator is the tongue, but the jaw, lips, soft palate and teeth are also involved.
The speech spectrum starts at the fundamental frequency and then the resonances afterwards vary in magnitude. If you smooth the spectrum envelope you get local maxima which represent the formants. The first two formants, F1 and F2 are the most important and are shaped by the tongue.
The larynx is not the only source of sound in the human vocal tract however; sound can be generated anywhere there is a partial constriction, by exciting a resonance, vibrating an articulator or by releasing a blockage.
A voiced sound is one in which the vocal cords are vibrating, whereas an unvoiced sound is one in which the vocal cords are not vibrating.
A fricative sound results from a turbulent air flow at a constriction, and a plosive sound occurs after a blockage is released.
The Holmes Parallel Formant Synthesiser
The Holmes parallel formant synthesiser is capable of producing speech that is indistinguishable from the real thing (if properly controlled). 12 parameters are updated every 10 ms:
- FN: the low-frequency formant (fixed at 250 Hz);
- ALF: the amplitude of the low-frequency region;
- F1: the frequency of the 1st formant;
- A1: the amplitude of the 1st formant;
- F2: the frequency of the 2nd formant;
- A2: the amplitude of the 2nd formant;
- F3: the frequency of the 3rd formant;
- A3: the amplitude of the 3rd formant;
- AHF: amplitude of the 4th formant (fixed at 3500 Hz);
- V: degree of voicing;
- F0: the fundamental frequency;
- MS: glottal pulse mark/space ration (fixed).
Hearing
The auditory system has evolved for acoustic sensing, sound localisation and communication, so is more general purpose than the articulatory system.
The human ear consists of the outer ear, middle ear and inner ear.
There are diagrams
on the slides.
Outer Ear
The pinna (outside ear) protects the entrance to the ear canal, and its shape makes it directionally sensitive at high frequencies. The external canal (meatus), is a tube (approximately 27 mm in length and 7 mm in diameter) that leads from the pinna to the middle ear. The meatus terminates at the cone shaped tympanic membrane (eardrum).
Sound waves entering the ear impinge upon the eardrum and cause it to vibrate.
Middle Ear
The middle ear transforms the vibration of the eardrum into oscillations of the liquid in the inner ear by vibrating the oval window. The necessary impedance matching (between the air and the liquid) is achieved by a group of bones (the ossicles) acting as a system of mechanical levers.
The pressure arriving at the oval window is about 35 times greater than that arriving at the eardrum, and this mechanical amplification allows us to hear sounds up to 1000 times weaker than otherwise.
Muscles attached to the ossicles alter the amount of amplification to protect the inner ear from potential damage due to high sound levels.
Inner Ear
The transformation from mechanical vibrations to electrical nerve impulses takes place in the snail-like structure of the cochlea. The cochlea is about 35 mm long and is filled with a colourless liquid called perilymph.
It is divied into two regions along its length by a membrane structure called the cochlea partition, and a channel filled with a liquid called endolymph. The cochlea partition is bounded by the basilar membrane and Reissner's membrane.
The mechanical properties of the basilar membrane determine how the cochlea responds to sound. Vibrations entering at the oval window set up travelling waves which lead to peaks of energy at different places along the cochlea depending on frequency - nearest the oval window for high frequency sounds, but further away for low frequency.
The organ of corti transform the mechanical movements into electrochemical pulses by bending the outer hair cells (of which there are 25,000). These actions are equivalent to a bank of bandpass filters.
Spectograms
A waveform of the current spectrum is often not enough to usefully represent speech which changes too quickly to be usefully represented in that manner. Spectograms are often used instead, which show time on the horizontal axis and frequency on the vertical one with black dots indicating if that frequency was active at that time (using a bank of bandpass filters).
Wideband speech spectograms show good time resolution (enough to show the closure of the vocal cords), but poor frequency selectivity. Narrowband speech spectograms show the converse: good frequency selectivity but poor time resolution. The individual formants and their changes over time are clearly visible on these type of spectograms.
A common misconception is that wideband and narrowband spectograms show different scales of frequency - this is not the case, they have the same frequency scales, just at different selectivities.
The cochlea appears to be a mixture of both, using a narrowband spectogram at low frequencies, and a wideband spectogram at high frequencies.
Experimental evidence suggests that the auditory system encodes the excitation pattern using two different mechanisms: place theory, where the frequency is encoded by the position of the peaks in the auditory excitation pattern, and timing theory, where timing is preserved by phase-locking in the auditory nerve.
It is possible that timing mechanisms dominate up to 4 kHz, and place mechanisms at higher frequencies.
Further sound processing concerns is that of humans having two ears - binaural auditory processing. One possible reason is sound localisation, to direct visual attention, with two possible mechanisms: inter-aural time differences (ITD - that is, the difference in time between when a sound reaches the two ears is used to compute its location) and inter-aural level differences (ILD - that is, the difference in amplitude between the waves as it reaches the two ears).
Listening in complex acoustic environments is a difficult challenge, and a field known as auditory scene analysis has popped up to tackle this.
Psychophysics
The human ear varies in sensitivity and selectivity for sounds with different loudness and frequency components. These effects are studied in auditory psychophysics.
Loudness
The human ear has a huge dynamic range. The sound pressure level (SPL) is measured in dB (a log scale, where a 2 dB increase in sound level is a doubling of energy), and humans can comfortably hear from a few dB up to about 85.
See slide 28 for audiograms
of perceived loudness.
The unit of loudness is the phon. A phon is defined as the level (in dB) of a 1 kHz tone judged to be of the same loudness as the test stimulus. 0 dB SPL has been arbitrarily defined as 2 × 10⁻⁵ Nm-2. Perceived loudness varies with duration, fatigue and sound complexity.
Frequency
The frequency range of human hearing lies between about 20 Hz and 20,000 Hz. The ability to discriminate energy at different frequencies (the difference limen - DL) decreases at higher frequencies: e.g., 0.2 Hz at 100 Hz, 1.5 Hz at 2000 Hz, 30 Hz at 12,000 Hz.
The subjective pitch of a sound is non-linearly related to its frequency, and is expressed using the mel scale: 500 mels = 400 Hz, 1000 mels = 1000 Hz and 2000 mels = 3000 Hz.
Auditory filters
Low frequency sounds can mask higher frequency sounds because of the overlap between auditory filters. The shapes of these fulters can be estimated using masking experiments, and the bandwidth over which masking operates is termed the critical band.
Critical bands are estimated to be constant at 100 Hz for centre frequencies below 500 Hz, and increase proportionally above that. Critical bands are plotted on the Bark scale (1 critical band = 1 Bark).
Lower frequencies mask the sound of higher frequencies in the same critical band. Compression algorithms such as MP3 take advantage of this.
The shapes of the auditory filters are revealed by deriving psycophysical tuning curves. These shapes are revealed to be very sharp and hard to reproduce.
Hearing Loss
One type of hearing loss is that of loss of frequency sensitivity, which can be simulated in PureData. Cochlear implants can be used which stimulate the nerve in the same way the cochlear would, but with considerably less fidelty.
As speaking also depends on hearing through the feedback link, then pronunciation and speech can also deteriorate if hearing does.
Speech
Speech is the most sophisticated behaviour of the most complex organism in the known universe. Understanding how speech works is much more challenging than rocket science.
Speech is continuous (in a spectogram, you can't see where one word stops and another begins - there are no gaps), variable (there are 6500 million people in the world, each speaking with their own idiosynchracies), ambiguous, rich in information, multimodal, contaminated, disfluent and multi-disciplinary.
There are up to 8000 languages, where about 6500 are considered living, and 6000 with registered population figures. 52% of these are spoken by less than 10,000 people; 28% by less than 1000 people, and 83% are limited to single countries.
Within any given language, groups of individuals use local dialects (different words) and accents (different sounds), which reflect regional or social situations.
Even within a given language group, different individuals sound different due to inter-speaker variation (age, gender, physical characteristics e.g., vocal tract size and social habits) and intra-speaker variation (physiolocial, psychological and external factors).
These external factors include noise, leading to hyper-articulation or the Lombard effect (varying amplitude to account for noises in the environment), vibrations, what the task is, who the listener is, emotion, cognitive load and alcohol or drugs.
Continuity also affects variability - fish and chips becomes fish'n'chips, temporary becomes tem'pry, etc... This is not sloppy speaking, but a normal part of communicative behaviour that balances the demands of speaking against the demands of listening.
People can control their variances - volumne, speed, clarity and style, and this can change during a single utterance. There is also inherent variation. This variability means that signals that we'd like to be the same are actually different.
Speech is also ambiguous - this arises when signals we'd like to be different end up being the same ("to", "two", "too", etc).
Speech is language+ - it is rich in linguistic information (what is being said), para-linguistic information (how it is being said - individuality, attitude, emotion) and extra-linguistic information (other speaker-generated behaviour - breathing noises, lip smacks, etc).
Speech is not just an acoustic signal - it is also visual. Listeners can derive a large benefit from seeing a speaker's lips - equivalent to a 12 dB SNR gani in a noisy environment. This visual information can even override the acoustic information (the McGurk Effect).
Speech is also contaminated - everyday speech which occurs in normal environments includes other voices, competing sounds, noise & distortion and reverberation.
Speech is also disfluent. Normal spontaneous speech contains false-starts, repeats, filled pauses (ums and ahs) and overlaps. Spoken utterances are not as well-formed as written sentences. These so-called disfluencies make speech easy for a human to produce and understand.
Finally, speech is multidisciplinary. The different topics of speech are built from aspects of engineering, AI, linguistics and psychology.
Representing Sound
Writing is an ancient technical artefact that has been invented by people for use as a communication aid. Writing allows information to be transmitted over space, and stored over time. A vocal equivalent would be the telephone and voicemail.
Most languages have a writing system, with the most basic unit being the word (which carries meaning) which are depicted using alphabets, syllabaries, logographs or ideographs. Meaningful utterances are made up from sequences of words.
Writing systems that use alphabets and syllabaries are phonetic - i.e., they are based on how the words sound, but there is a closer relationship between spelling and pronunciation in some languages (e.g., Koren) than others (e.g., English - only a loose connection). Some languages (e.g., Mandarin) have a complete dissociation between written and spoken languages.
The syllable is the shortest stretch of speech, and words can be monosyllabic (only one syllable) or polysyllabic (two or more syllables). Syllables consist of consonants and vowels.
Syllables consist of consonants and vowels, and a simple CVC syllable corresponds to the opening and closing of the mouth. Words can be described in terms of their CV skeleton (e.g., eye = V, draw = CCV, signal = CVCCVC, etc).
Sound based writing systems consist of syllabaries, which has symbols which represent a consonant plus a vowel, or just a single vowel (e.g., Cherokee and Japanese). Abjads are systems such as Aramaic or Hebrew where the symbols represent consonants only, and tend to be written right-to-left. Alphabets are systems where the symbols represent consonants and vowels.
Sound-based writing can be thought of as a kind of visible speech, and is the name given to a sound-based writing system invented in 1867 by Alexander Melville Bell, where symbols are intended to represent the shape of the mouth and tongue.
Languages use around 200-300 basic sounds, or phones, and the International Phonetic Association (IPA) has agreed a set of standard symbols for representing any speech sound. A trained phonetician can use the IPA symbols to transcribe spoken utterances from any language (even a newly discovered one) or any speaker.
Most languages use roughly 40 phones, but the IPA symbol set allows much finer detail to be captured if necessarily using suprasegmentals and diacritics.
The IPA chart shows us pulmonic (driven by the lungs) and non-pulmonic (clicks, implosives, ejectives, etc) consonants, vowels, suprasegmentals (stress, accent, tone, etc) and diacritics (which show fine phonetic detail).
In addition, but becoming decreasingly relevant are machine readable phonetic alphabets, such as SAMPA (speech assessment methods phonetic alphabet) which allow you to enter ASCII characters equivalent to IPA characters.
Articulatory Phonetics
Articulatory phonetics refers to the speech sounds in terms of the physical actions performed in their production.
Speech sounds are classified in articulatory phonetics in different ways depending on the type of sound. All sounds are classified by where the air stream comes from, and whether the air is being breathed in or out.
For consonants, the described qualities are voice (whether or not the vocal cords are vibrating), place of articulation (where the constriction is made), and the manner of articulation (how the sound is made).
For vowels, the position of the tongue and shape of the lips are the qualities that classify the vowel type.
Consonants
Voicing has been covered before, but there are various fine details - the degree of voicing (typically just voiced and voiceless), and the voice quality (modal, creaky, falsetto, breathy).
Place of Articulation
Articulation refers to the constriction of the vocal tract during speech production and involves the movement of an active articulator towards a passive articulator.
The places of articulation are given different names, starting at the lips moving backwards through the mouth:
- bilabial - active: upper and lower libs, and no passive;
- labiodental - active: lower lip, passive: upper front teeth;
- dental - active: tongue tip, passive: upper front teeth;
- alveolar - active: tongue tip or blade, passive: alveolar ridge;
- postalveolar - active: tongue tip or blade, passive: rear of alveolar ridge;
- retroflex - active: tongue tip, passive: hard palate;
- palatal - active: tongue front, passive - hard palate;
- velar - active: tongue back, passive: soft palate;
- uvular - active: tongue back, passive: uvula;
- pharyngeal - active: tongue root, passive: rear wall of pharynx;
- glottal - active: vocal folds, and no passive.
Manner of Articulation
The manner of articulation refers to the way in which the airstream is modified by the primary and secondary articulators. There are varying degrees of stricture: closure (stops - articulators are in firm contacts), narrowing (fricativees - articulators are close together but not touching) and approximants (a wide gap between the articulators).
The sounds resulting from closure or narrowing are termed obstruents, and the rest are called sonorants.
Stops are complete blockages of the airstream and can be produced at many different places of articulation. Stops made with a velic closure are called oral stops, and stops made without a velic closure (and with airflow through the nasal cavity) are called nasal stops.
In oral stops, air pressure rises rapidly in the vocal tract during closure, and the compressed air bursts out of the vocal tract with a small explosive noice when the closure is released. Such sounds are called plosives, and slower release sounds are called afficates.
For fricatives, sound is produced between a very narrow opening between the active and passive articulators. The resulting airflow is turbulent and hence noisy. Air for a median fricative flows though a narrow channel in the centre of the cavity, and for a lateral fricative, through a narrow space at the sides of the tongue.
Sonorants do not have a stricture narrow enough to cause turbulence, so these are called approximants. Lateral approximants have complete closure on the midline, and median approximants have no complete closure and are also called semi-vowels and glides.
In taps, the closure (tap or flap) is much shorter than for a plosive, hence there is no build up of air pressure. For trills (or rolls), these consist of a series of rapid tap-like closures.
Voice, place and manner are represented on the IPA chart (voice in the pairs, manner on the vertical axis and place on the horizontal axis), and are used as labels as the standard method of specifying consonants.
Vowels
Vowels are articulated by raising the front or back of the tongue towards the roof of the oral cavity and shaping the lips, thereby changing the vowel quality.
Vowel quality is governed by vowel height, vowel location and lip position (rounded, or unrounded).
The height of a vowel refers to the relationship between the highest point of the tongue and the roof of the oral cavity. A close, or high, vowel is produced when the tongue is raised closed to the roof, and an open, or low, vowel is produced when there is a wide gap between the highest point of the tongue and the roof of the oral cavity. Vowels can also be mid, half-close and half-open.
The location of a vowel refers to the part of the tongue which is highest. A front vowel is produced by raising the front part of the tongue towards the hard palate. A back vowel is produced by raising the back part of the tongue towards the soft palate. A central vowel is produced by raising the central part of the tongue towards the junction of the hard and soft palates.
The mid-central vowel is called 'schwa'.
Additionally, many languages make a distinction between long and short vowels, oral and nasalised vowels and monophthongs and diphthongs (vowel glides).
Vowel quality can be indicated either by placing a dot on the vowel quadrilateral, or relating it to a set of language independent cardinal vowels (those at the extremes of the vowel quadrilateral).
Vowels appear to carry less information than consonants and seem to act as a carrier signal that is modulated by the consonants. For these reasons, vowel qualtiy is very variable and can drift over time, hence giving rise to differences between historical and contemporary accents.
Acoustic Phonetics
Acoustic phonetics is a description of speech sounds in terms of the acoustic consequences of their production.
Some speech sounds (continuants) can be sustained over time and retain their phonetic quality, e.g., monophthong vowels, fricatives, some approximants and nasals.
If you take a scatter graph of F1 vs. F2 of the vowels (the first two formants) and then rotate it and overlay it on the vowel quadrilateral, you will find a direct relationship between the location of the vowels and their location on the vowel quadrilateral - which we have already discussed is linked to the location of the tongue in the mouth.
Voicing also changes the spectrogram of the consonants, e.g., in voiceless fricatives, there is no appreciable energy at low frequencies, whereas voicing energy shows at low frequencies.
Nasal sounds also have a very low formant.
The essence of some speech sounds is that they change over time - these are called non-stationary sounds, and include diphthong, stops, affricates and glides.
The spectograms for stops show a lack of energy leading to a build-up of air for the plosive, with a difference between voiceless and voiced stops - voiced stops have a shorter plosive at the end of the stop. This is characterised with the voice onset time - the difference between a voiced and voiceless part of speech. VOT is the time for a voiced vowel to start, so is understandable shorter when the previous consonant was voiced.
For close phonetic transcription, diacritics can be used, e.g., [ph], which indicates an aspirated [p], where aspiration is where a larger than usual outtake of breath is used.
Speech can be segmented into different acoustic segments based on acoustic segmentation points where the quality of the sound changes (e.g., before and after the release in a stop/plosive), and these in turn correspond to the phonetic segments, which can have multiple phonetic segments.
Speech segmentation is not easy, and can be considered to be a pattern recognition problem.
In the late 1970s, there was a general consensus that there was insufficient information in the speech signal to perform automatic speech recognition. In the late 1980s, Victor Zeu taught himself to read spectrograms, and proved that there was enough information.
Whispered speech is interesting in that it shows no voicing.
Co-articulation is when sounds influence those sounds around it (e.g., voicing the end of an unvoiced sound as the next sound is voiced).
Co-articulation can be considered as a context-dependency issue from a engineers point of view, but from a phonetician, coarticulation is a consequence of efficient motor planning.
Co-articulations can be long range (e.g,. the influence of nasalisation and lip rounding can span several syllables).
Phonology
The phonetic description of speech is language independent, and the sound system of a particular language is called its phonology.
In practice, all sounds can occur in all languages, but only some are contrastive (i.e., distinguish one word from another). These contrastive sounds are called phonemes.
One way to describe it is that phonemic is what is perceived, and phonetic is what actually happens.
The English words fussy and fuzzy are known as a minimal pair, that is, a single sound change changes the meaning of the word. Existence of this phonomena is evidence of a phonemic contrast, therefore we say that [s] and [z] are phonemes in English, as this voicing is said to be contrastive.
In order to prove that a phonetic distinction is contrastive in a particular language, it is necessary to find a pair of words that differ in only one segment, and this differing segment must be in the same position in each word, and the two words must be semantically distinct (i.e., not alternative pronunciations of the same word).
The phoneme is the minimal unit of sound that distinguishes one word from another in a given language. The phonemic inventory of a language is found by exploring all of the possible minimum pairs.
A phonemic transcription is distinguished from a phonetic transcription by using /slashes/.
Phonemes might seem like an abstract concept, however as an individual becomes familiar with their own language, they find it increasingly difficult to both hear, and pronounce, non-phonemic differences. For example, Japanese does not have a phonemic distinction between [ɹ] and [l], these are both allophones of /l/. An allophone is therefore a phonetic variant of an underlying phoneme, or the set of different phones that make up a given phoneme.
Given a particular language, the distribution of allophones is not random, but based on the way in which different phonetic features are used to achieve phonemic contract. For example, in English, voicing is contrastive, but languages in which it is not exist, such as Dyribal, which uses free variation.
There are other phonological processes that occur as well, such as place assimilation (or feature spreading), where the following sound influences the sound before for efficieny. e.g., in can be, the /n/ becomes a phonetic [m] (i.e., the bilabial b makes the /n/ a bilabial [m]).
Deletion (elision) is also for efficiency, as compression allows us to speak faster (e.g., "I don't know" to "I dunno"), and this only becomes a problem is the shortened word has a different meaning.
Insertion (or epenthesis) is the insertion of sounds, e.g., [ɹ] between vanilla and ice cream, to make the two vowel sounds run together in speech.
Prosody
Prosody is one way in which speakers are able to signal important information in what they are saying. It allows different words to be emphasised and is critical to communicating unambiguous meanings. It's similar to the use of punctuation in text, but prosody carries much more information.
Prosodic features span several speech segments, several syllables, or even whole utterances. Such suprasegmental behaviour includes lexical stress and tone, rhythmic stress, and intonation - which are all carried by pitch, timing and loudness.
Lexical stress refers to the prominence of syllables in words. A stressed syllable is usually louder, and/or higher pitch, and/or longer than its neighbours. The location of the stress can be marked using a diacritic.
The location of lexical stress can vary as a function of different suffixes. The shift of lexical stress away from a syllable often causes a weakening of the vowel (known as vowel centralisation or reduction as it moves towards schwa). Lexical stress can also be contrastive (e.g., between billow and below).
Roughly a half of the world's languages use the pitch pattern to distinguish between one word and another. Modern standard Chinese has four lexical tones - high level, high rising, low falling-rising, high falling.
Languages with a moving pitch pattern are called contour tone languages, and ones with entirely level tones are called register tone languages.
Rhytmic, or sentential, stress refers to the stress pattern across a sequence of words. The syllable which is most stressed is the primary, or nuclear, accent, and is called the nucleus. In many languages, the pattern of stress defines the rhythm of speech.
The stretch of speech between the most stressed syllables is called a foot. English is said to be stress-timed, as the strong syllables tend to occur at roughly equal intervals (isochronous feet). French does not have this property and is said to be syllable-timed.
Sentential stress is used to signal the key information-bearing words in an utterance. Content words are often stressed, but function words rarely are. This allows a speaker to contrast different words (and meanings) by placing the nucleus on different syllables.
Pitch variation that doesn't affect the meaning of the words, but does affect the meaning of an utterance is known as an intonation (particularly a rising intonation differentiating between questions and statements).
The type of pitch contour at the nucleus is known as the nuclear tone. In English, there are 6 nuclear tones: low fall, high fall, low rise, high rise, fall rise and rise fall.
Different nuclear tones are used to signal different things. A falling tone can indicate that information is being added, or the utterance has come to an end. A falling-rising tone can indicate that information is already part of the background, and a low rise can sound sympathetic and reassuring, or a signal that more is to come.
All of these indicators are included in the suprasegmentals section of the IPA chart.
Signals
A signal is a physical quantity that can carry information. Discrete signals are selected from a finite alphabet, or 'code book', and continuous signals derive from a scalar measurement along a particular dimension, or a vector of measurements in a multi-dimensional space.
Signal processing is the analysis, interpretation and manipulation of sensor data, such as computing global statistics (means, mods, minima, maxima, etc), finding patterns in the data, deducing the causes of the data, or transforming the data.
Microphones
Microphones convert, or transduce, acoustic energy into electrical energy.
Dynamic (moving coil) microphones are based on electromagnetic induction (the sound waves hit a diaphragm which vibrate a coil of wires over a magnetic, hence inducing an electric current), and are rugged, capabable of handling high sound levels, and are cheap, but have a limited frequency response.
Condensor (electrostatic) microphones are based on variable capacitance (the front plate is a diaphragm, and the back plate is static, forming a capacitor in a powered electric circuit). They have a flat frequency response and are sensitive, but can be distorted with loud sounds, requires a power source and are expensive.
Signals come in two types: deterministic (which are fully-predictable, given the generator - the sound at some time t is causally related to the sound at time t + 1) and non-deterministic (which are functions of some random variable, and not fully predictable).
Deterministic signals are also broken up into aperiodic (non-repating) and periodic signals. Periodic signals have some period τ, defined such as a(t) = a(t + kτ) ∀ t ∈ R and k ∈ N.
Sinusoids
Sinusoids are particularly important periodic signals, and are projections of a fixed length vector rotating at a constant velocity. With a sinusoid the amplitude at a time t is defined as A.sin(ωt), where A is the radius (the length of the rotating vector, and the peak amplitude), Θ is the angle (in radians), f = 1/τ - the frequency in Hz, &omega = 2πf - the angular frequency in rads/s and θ = ωt.
Sinusoids in equal frequency and magnitude may still be different due to phase - this is measured in radians as the phase delay (number of radians the second vector is behind the first). The special case of a π/2 (orthogonal) phase angle is called a cosine wave.
Orthogonal projections of a rotating unit vector can be used to define Euler's formula for the unit circle: eiωt = cos(ωt) + i.sin(ωt).
White Noise
White noise is a completely random stochastic signal - the value of the signal at time t gives no information about the value of the signal at time t + δt - i.e., they are completely uncorrelated.
White noise is characterised by some mean value μ and some standard deviation σ (or variance σ2).
White noise can follow an arbitrary noise distribution - e.g., uniform, or Gaussian/normal.
A stationary signal is one whose properties do not vary with time (e.g., a sine wave of constant amplitude and frequency, or a noise of constant mean and variance), whereas a non-stationary signal changes with time (e.g., amplitude modulation, frequency modulation, or a modulated mean and variance).
Speech is a mixture of periodic, aperiodic and stochastic signals, hence it is non-stationary by nature, however in practice, it is normally assumed that speech is stationary over a short time interval (about 10-30 ms). If this interval is too short, there is insufficient time to determine the signal properties accurately, but if the interval is too long, this "quasi-stationarity" is lost and the speech properties will vary significantly.
This quasi-stationary assumption is used in nearly all speech signal processing, despite being a gross approximation.
A signal may represent a sequence of any kind of measurement and it is common for signals to represent a sequence of measurements in time. A useful technique for signal analysis is to decompose it into a set of basic pieces that are easier to understand (e.g., linear trends). Decomposing into periodic functions can be thought of as transforming a signal into the frequency domain.
Fourier Analysis
Fourier analysis was introduced by Joseph Fourier (1768-1830) and is based on the theorem that any periodic signal of a frequency f0 can be constructed exactly by adding together sinusoids with frequencies f0 (the fundamental frequency) and 2f0, 3f0, etc... (the harmonics). Each sinusoid in this Fourier series is characterised by its amplitude and phase.
Lecture 12 contains some examples
for common waveforms.
We can consider a waveform by Fourier analysis as a projection of multiple vectors rotating at constant velocities.
Any periodic function can be characterised by the amplitude and phase of its sinusoidal components - its spectrum.
Periodic signals only have spectral components at integer multiples of the fundamental, whereas aperiodic and stochastic signals have spectra that are continuous functions of frequency (i.e., can occur at all possible frequencies). White noise is a special example of this, having a flat specturm (i.e., equal energy at all frequencies when integrated over infinite time).
Spectra representation we typically see are power spectrums - i.e., the energy present at each frequency. The power of a signal at each frequency is the sum of the squares of its real and imaginary components (e.g., a sine wave has varying amplitude but constant power), but a signal's spectrum is fuilly specificed by the magnitude and phase at each frequency - the complex spectrum.
Fourier Transform
The complex (magnitude and phase) spectrum is obtanied from a time signal by means of Fourier transform. Fourier transforms are lossless, meaning that the time signal can be recovered from the complex specturm by the means of an inverse Fourier transform.
Some information is lost during the calculation of the power spectrum (which stores no phase information) so the originally signal can not be recovered completely accurately.
Filters
A filter modifies the properties of a signal, and these effects can be analysed in the time or frequency domains.
Filters are typically characterised by its frequency response - low-pass filters only allow those signals below a certain cut-off frequency fc, high-pass filters above fc and band-pass filters which allow signals in a certain range around a central frequency fc.
For low and high pass filters, the frequency response is characterised by the cut-off frequency fc and the roll-off rate (measured in dB/octave). Real world filters do not cut off signals immediately at fc, but instead have a dampening effect around fc until it reaches 0 - the roll-off rate. A first-order filter attenuates at a roll-off rate of 6dB/octave.
The frequency response of a band-pass filter is characterised by the centre frequencyfc and the bandwidth, or 'Q' (centre frequency/bandwidth).
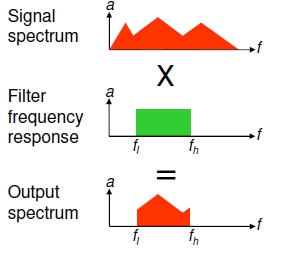
When signals pass through a linear filter, its specturm is multiplied by the frequency response of the filter.
An idealised impulse signal has a flat frequency response (note, white noise also has a flat spectrum). The impulse response of a filter thus has a spectrum that is equal to its frequency response.
If we design a filter with a frequency response equal to the spectrum of a (single cycle of a) vowel sound, and then input a sequence of impulses, we will generate the original vowel sound.
If we design a filter with the frequency response of an unvoiced fricative and input a white noise signal, we will generate the original fricative sound.
This is called the source-filter model.
Digital Signals
All natural signals (including speech) are analogue (i.e., they can assume an infinite possible values, and exist continuously in time), therefore, perfect processing of analogue signals require infinite resolution and infinite storage.
Any practical system must sacrifice fidelity in order to process signals using finite resources. Signals must therefore be quantised in each dimension. This is achieved by sampling. Speech signals are typically quantised in amplitude and sampled in time. This process is called pulse code modulation.
Quantisation errors occur when the signal is reconstructed from the samples and varies from the original continuous signal.
The range of numbers that can be used to represent a signal's amplitude defines the dynamic range of the system. In an n-bit system, the maximum value is 2n-1 and the dynamic range is 20log(2n-1) dB, e.g., 16 bits gives a 98 dB dynamic range.
The Nyquist-Shannon sampling theorem states that we need twice the number of sample points per second as the highest frequency in a signal. Sampling a signal lower than the Nyquist rate leads to aliasing (energy at frequencyes higher than the sampling rate are reflected back into the lower frequencies). In order to avoid aliasing, a low-pass filter is used on a signal before sampling: fc < 0.5fs, where fc is the filter cut-off frequency and fs is the sampling frequency.
Sampling theory states that sampling a continuous signal f(t) is equivalent to multiplying it to a Dirac delta function. This impulse is a rectange of unit area centred around t0 whose width tends to 0.
In the regeneration of the signal, a mirror image around 0.5fs appears as a signal of twice the frequency would also fit through the sample points exactly. This is why a low-pass filter is used to avoid this mirroring. If the cut-off point is above 0.5fs, then the mirror image will interfere with the recreated signal.
Speech has a bandwidth of ~10 kHz and a dynamic range of ~50 dB, hence the minimum quantisation and sampling requirements would seem to be a 20 kHz sampling rate and 8 bit quantisation - however it is possible to reduce both the bandwidth and dynamic range significantly before suffering a major drop in speech intelligibility (e.g., a telephone has a bandwidth from ~300 Hz to ~3500 Hz, but this causes a problem with sounds such as [f] and [s]). Digital speech codecs can make good use of lossy compression schemes.
Coding theory is derived from information theory and is based on probability theory and statistics. The most important quantities are entropy (information in a random variable) and mutual information (the amount of information in common between two random variables).
Information is usually expressed in bits - entropy indicates how easily data can be compressed, and mutual information can be used to find the communication rate through a channel. Coding theory is the most direct application of information theory through concepts such as source coding and channel capacity.
The data rate (or information rate) of a signal is expressed in bits per second (bps). The information rate in speech is estimated to be ~100bps, yet we need kbps coders to capture the sound data, rather than the underlying information. The way to code signals at lower rates is to exploit any redundancies in the signal - for speech, this can be achieved using predictive models. The ultimate predictive model for speech is speech recognition.
Very low rate speech coding would directly capture the communicative intent into a speech recogniser as linguistic and paralinguistic information, and then synthesise this into something that can be directly understood.
Block Processing
After capture through a microphone and digitisation through the ADC, an incoming speech signal becomes a sequence of quantised samples.
Digital signal processing is typically performed on a sequence of fixed-length samples called 'blocks' or 'frames' (e.g., in Pure Data, the default block size is 64 samples - i.e., a 1.45 ms frame at the default 44.1 kHz sampling rate).
Because of the quasi-stationary nature of speech, the frame size is a compromise of having sufficient data in a frame to make the required measurements, and having a small enough amount of data that the stationary assumption is fulfilled. It is also necessary to ensure that there are a sufficient number of frames to capture the non-stationary properties.
To accommodate all these constraints, it is usual to use overlapping frames in speech processing. The frame size (N) is the number of samples per frame, and the frame shift (R) is the number of samples between the start of successive frames.
Frame size is often expressed in time: NT seconds, where T is the sample period. Frame shift is often referred to as the frame rate: fr = 1/RT frames per second.
In speech it is usual to have a frame size (N) ≈ 30 ms, and frame rate (fr) ≈ 100 fps.
In Pure Data, the sampling rate is 44.1 kHz and block size is 64 samples. These can be overriden using the [block~] object, but not in the same patch as the [adc~] or [dac~] object. [block~] takes three parameters: a block size (in samples, which must be a power of 2), overlap (which must be a power of 2) and then the up/down sampling ratio (relative to the parent window). Only one [block~] object is allowed in a window.
Sample Processing
Sometimes it is necessary to process data one sample at a time. Pure Data provides an object for this: [fexpr~], which takes arguments dependent on $i#, an integer input variable on inlet #, and $f#, a flat input variable on inlet #.
Expressions are then constructed using $x#[n], the sample from inlet # indexed by n, $y[n], the output value indexed by n. $x# is shorthand for the current input, and $y is shorthand for the previous output (i.e., $y[-1]).
Speech/Non-Speech Detection
In speech processing, it is often useful to be able to detect when someone is speaking, but accurate speech 'end-point detection' is very difficult and to be avoided. The best place to do end-point detection is in the recogniser, not by pre-processing.
Short-time energy is the sum of the squares of the samples in one frame: E = ∑N-1i=0si2. In voiced speech, the short term energy is large.
The zero-crossing rate is the number of times the zero-axis is crossed in one frame. In unvoiced speech, the ZCR is large.
A simple speech/non-speech detector can be constructed using short-term energy and the zero-crossing rate.
Autocorrelation
The autocorrelation function computes the correlation of a signal with itself as a function of time: rk = ∑N-k-1i=0sisi+k.
The autocorrelation function emphasises periodicity (finding out when a signal correlates with itself at varying delays = finding out the periodicity), and is the basis for many spectrum analysis methods.
The autocorrelation function (ACF) is fairly expensive to compute, because there is an inner loop running for every data sample.
The short time autocorrelation function (STACF) is the basis for many pitch detectors (fundamental frequency estimators). STACF is often combined with ZCR to construct a voiced/unvoiced detector.
Random, or noisy, sound has no peaks, therefore has a consistently low autocorrelation - however, the autocorrelation function always shows a peak at shift = 0, because a signal always correlates perfectly with itself in the same phase.
Correlation
The correlation between two discrete-time signals s and t over an N point interval is q = ∑N-1i=0siti.
For two sinusoids (where N and T are chosen so the summation is over an integer number of cycles for both signals), it can be shown that q = αA if ωs = ωt, 0 otherwise, where α is some constant.
It shows for sinusoids that if the sinusoids match, then there is a very high correlation, otherwise there is 0 correlation.
Therefore, the correlation between a test signal t[NT] and a target signal s[NT] is proportional to the amplitude A of the target signal when cos(ωsNT) = cos(ωsNT). Given that Fourier analysis shows that any signal can be decomposed into sinusoidal waves, cosine correlation can be used as a method to find (extract) the cosine components of an arbitrary signal. This is only possible if the correlation is computed over an integer number of p cycles in the test signal.
Therefore, the spectrum computed by cosine correlation is Sp = ∑N-1n=0sn.cos(2πnp/N), where p is an integer.
The cosine correlation considered before if all signals have zero phase. The correlation between two cosines is also a cosine (varying according to the phase difference between them). Being in-phase has maximum correlation, and a 90 degree phase difference is 0 correlation.
This means that cosine correlation can not detect a π/2 phase shift in a target signal.
However, the correlation between a cosine and a sine is a sine (varying according to the phase difference between them), so in-phase has 0 correlation and a π/2 phase difference (maximum correlation).
Sine correlation gives the same behaviour as cosine correlation (cosine correlation with cosine is also a cosine, sine correlation with sine is also a sine), and the sine and cosine correlations are π/2 out of phase.
These methods provide the basis for a general method for calculating a spectrum.
If we correlate a signal with both sines and cosines, we can get the amplitude of a sinusoidal component independent of phase as α = √.
The phase of this component can then be obtained as φ = tan-1((α.sin(φ)2)/(α.cos(φ))2).
Fourier Transform
If you recall that any periodic signal can be expressed as the sum of a fundamental sinusoid and its harmonics, then the individual components at a frequency Ω = pω can be found be correlating s(nT) with cos(ΩnT) and sin(ΩnT).
If we let c(Ω) be the cosine correlation c(Ω) = ∑N-1n=0s(nT)cos(2πnp/N) and s(Ω) be the sine correlation s(Ω) = ∑N-1n=0s(nT)sin(2πnp/N), p = 0, 1, ..., N-1, then:
ap = √ and φp = tan-1(s(Ω) / c(Ω)).
This is the discrete Fourier transform.
The DFT is often expressed using complex number notation. The cosine and sine correlations are associated with the real and imaginary parts of a complex number: sp = ∑N-1n=0s(nT).e-j(2πnp/N).
Hence, the DFT can be expresed as sp = ∑N-1n=0s(nT).e-j(2πnp/N), p = 0, 1, ..., N-1, where sp is a complex number whose magnitude and phase correspond to that of the spectrum s(nT) at a frequency p/NT.
From this, we can note the inverse DFT: s(nT) = 1/N∑N-1p=0 sp.ej(2πnp/N), n = 0, 1, ..., N-1.
Increasing the analysis frame decreases the spacing between the spectral components, and reduces the ability to respond to changes in the signal, hence a large N leads to narrowband analysis - good spectral resolution, but poor time resolution.
Decreasing the analysis frame N increases the spacing between the spectral components, and increases the ability to respond to changes in the signal. Hence, a small N leads to wideband analysis - good time resolution and poor spectral resoltuion. This is the time-frequency trade-off we saw earlier.
The DFT computes the spectrum at N evenly spaced discrete frequencies. It assumes periodicity outside the analysis frame with a period equal to the frame length. This means that discontinuities will arise for periodic signals with a non-integer number of cycles in the analysis frame, all aperiodic signals and all stochastic signals. Such discontinuities give rise to unwanted spectral components.
The discontinuities arising from segmenting the signal into frames distorts the spectrum. The distortion can be reduced by multiplying each signal frame with a window function. The most common window function is the Hamming window.
Windowing attenuates the components caused by the discontinuity, but also smears the spectral peaks.
Implementation of the DFT requires O(N2) multiply-add operations, however by exploiting symmetry, it is possible to devise an algorithm that requires on Nlog2N multiply-add operations - this more efficient algorithm is the Fast Fourier Transform.
The FFT requires that the window/frame should be a power of 2 in size. This can be achieved by choosing the appropriate analysis frame size, and/or zero-padding a frame to the nearest power of 2.